Infrastructure automation
Terraform & Ansible Automation
A documented AWS setup that divides infrastructure provisioning and host configuration.
By Himan MandujaSource reviewed Reviewed commit 68b8c51 ↗
On this page
Terraform and Ansible solve different parts of an infrastructure problem. This AWS demo connects them: Terraform creates the network and machines, while Ansible installs containers and monitoring services on those machines.
The application infrastructure has been destroyed, as the README explicitly records. The case study is about the checked-in automation and captured deployment evidence. It does not rely on the old service URLs continuing to work.
Provisioning versus configuration
The Terraform layer describes AWS resources and exposes the addresses Ansible needs. Remote state uses S3 with DynamoDB locking, separating infrastructure state from a developer’s local checkout. The configuration-management layer then uses SSH to install Docker, pull application images, and start services.
This boundary is useful because an application release need not recreate its EC2 hosts. Conversely, changing a subnet or host definition belongs in Terraform rather than being hidden inside a deployment script. The Ansible entry point makes the host roles visible.
The infrastructure that is defined
The VPC definition uses a 10.0.0.0/16 network, with public and private subnet resources in one availability zone. A critical distinction is where the instances actually go: the frontend, backend, and monitoring EC2 resources all use the public subnet. The private subnet is defined but unused by those hosts.
That makes this a three-host public-subnet demo, not a private backend architecture. The diagram reflects that assignment. The application hosts receive stable public addresses, and the security-group configuration exposes several application and monitoring ports publicly.
Following an image into deployment
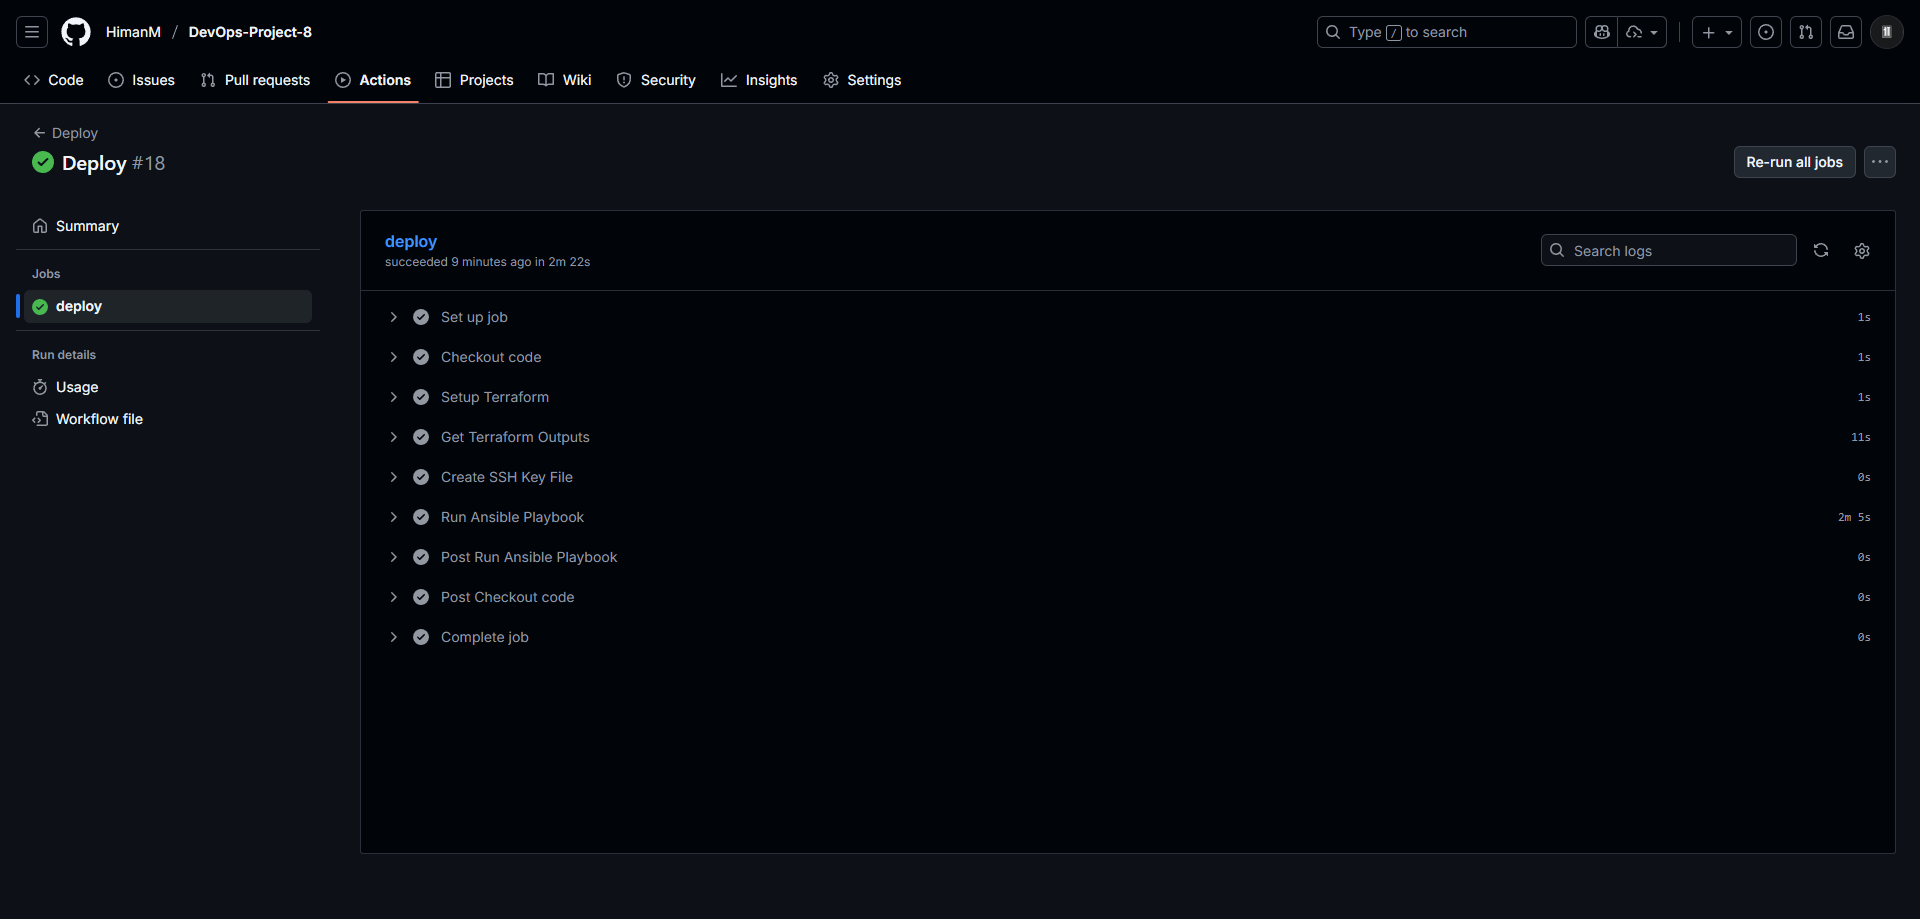
Changes under app/** trigger the image workflow. It publishes frontend and backend images to GHCR using both a commit-derived tag and latest. A successful image build can trigger the deployment workflow.
The deployment job reads Terraform outputs, writes the SSH key, creates the inventory, and passes the image tag to Ansible. Infrastructure changes have a separate workflow that initializes and plans Terraform, then applies automatically on qualifying main-branch pushes. These are distinct automation paths, not one indivisible pipeline.
Metrics and logs
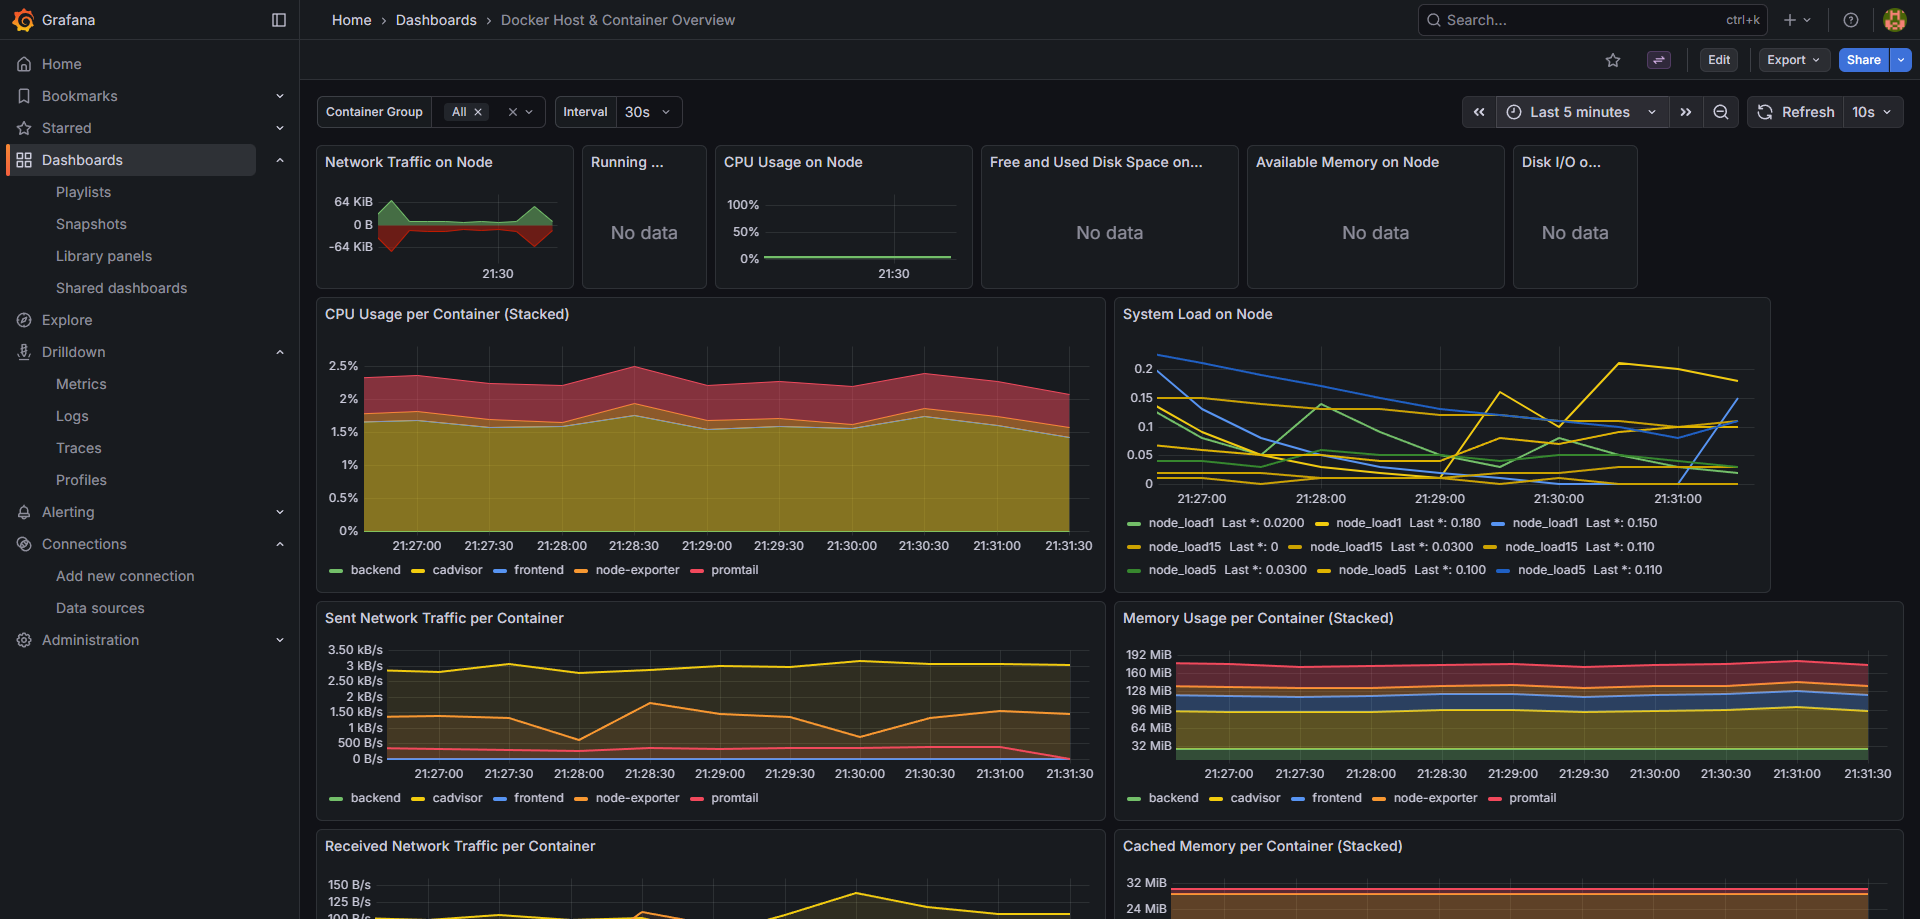
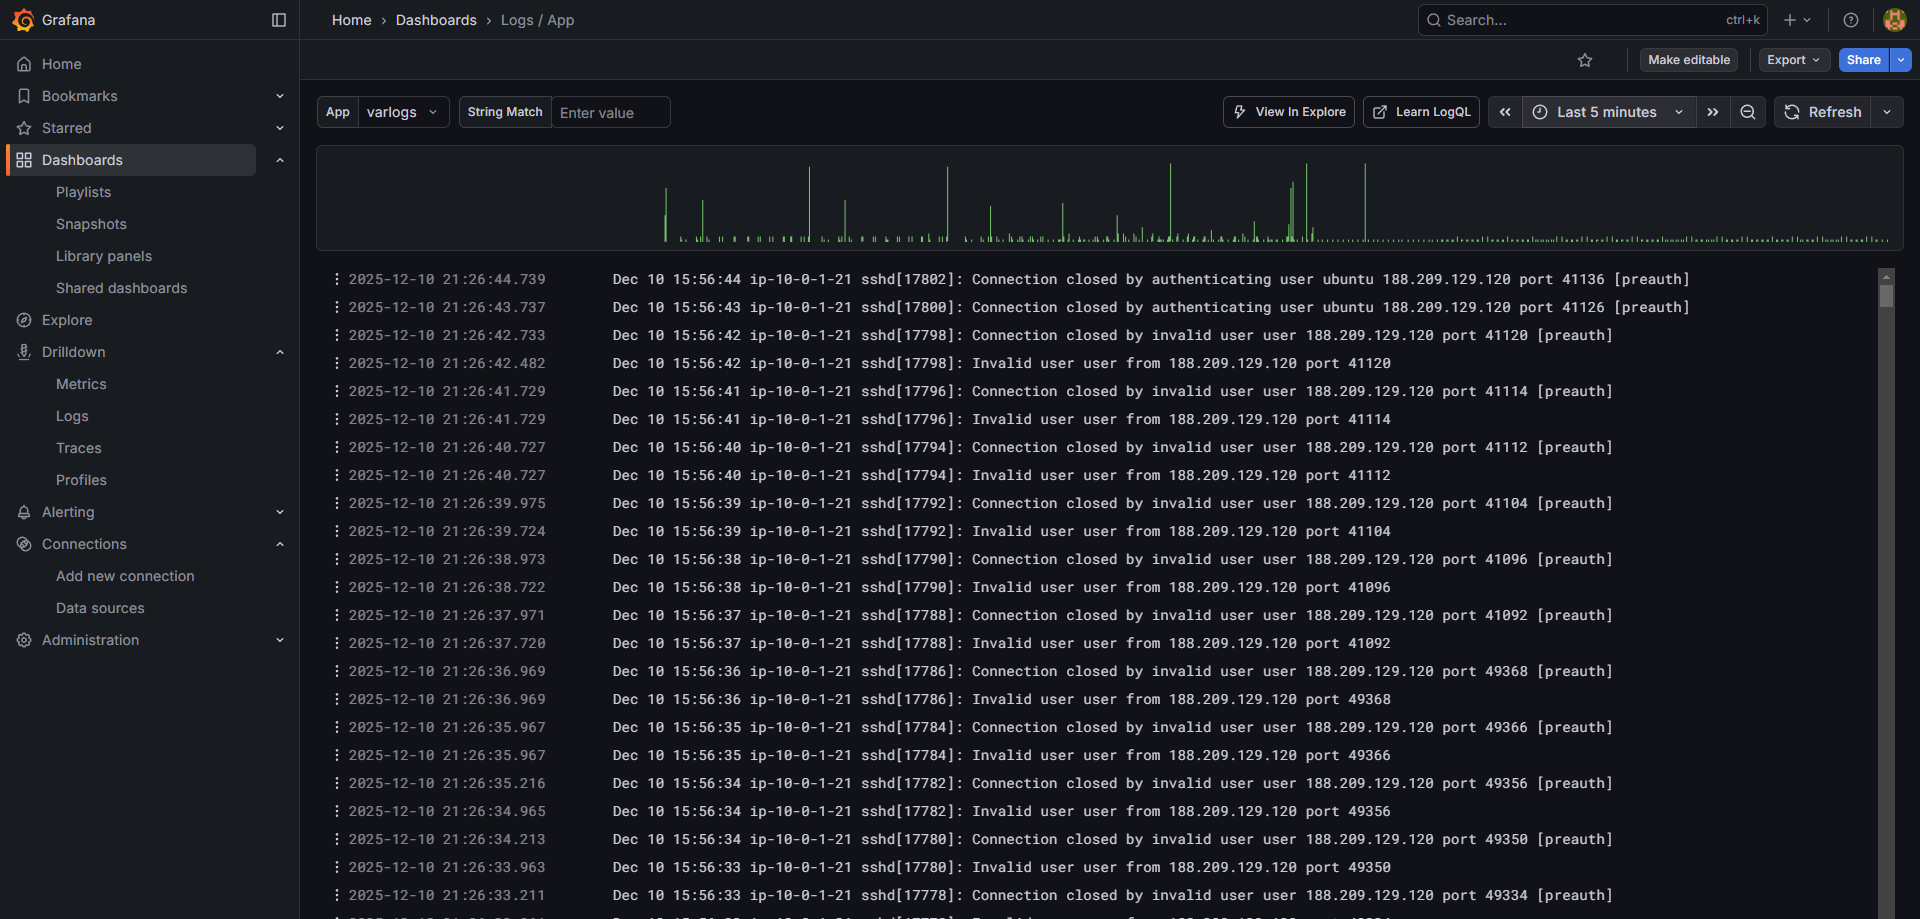
The monitoring role runs Prometheus, Grafana, and Loki. Node Exporter and cAdvisor provide host and container metrics, while Promtail handles log collection. This creates a concrete comparison between machine health, container behavior, and application logs.
Repository screenshots show workflow execution, state storage, EC2 resources, and monitoring dashboards. They support a historical walkthrough. They do not establish current uptime, alert effectiveness, or a measured reliability improvement.
What the demo establishes
The project demonstrates the handoff from infrastructure outputs to host configuration and application delivery. Its limits matter just as much: it uses one availability zone, broad public security-group rules, long-lived AWS key secrets, and automatic Terraform apply on main. Those choices do not establish a hardened enterprise deployment.
There is also a manual-trigger edge case. The deployment workflow derives its image tag from a completed upstream run; a direct manual dispatch does not provide that same value. The Ansible default does not automatically replace a defined empty string. Explicit input validation would make that release path more dependable. Narrower access rules and OIDC would be worthwhile changes before reusing this design outside a lab.
Source files
- Network definitionThe public and unused private subnet resources.
- Security groupsActual inbound exposure of application and monitoring ports.
- Deployment workflowTerraform outputs, inventory, and image-tag handoff.
- Monitoring Compose templateMetrics and logs services installed on the monitoring host.